FAQ
What exactly does this map show?
Many aircraft broadcast information about how accurate their navigation system (which is almost always GPS) is at any given moment. The GPSJAM map aggregates that data over 24 hours in time and displays it as a hexagonal map. Green hexagons show where more than 98% of all aircraft who flew through that area reported good navigation accuracy. Yellow hexagons show where between 2% and 10% of aircraft reported low navigation accuracy. Red hexagons show where more than 10% of aircraft reported low navigation accuracy.
Areas where a significant percentage of aircraft report low navigation accuracy seem to correlate well with areas of known and suspected jamming activity.
Where does this data come from?
Many aircraft broadcast digital radio messages (ADS-B) that contain information about their GPS accuracy. ADS-B Exchange is a network of thousands of enthusiasts who receive those signals. I use the ADS-B Exchange API to collect and process the data and build maps from it.
Is it just GPS? What about GLONASS, BeiDou, Galileo, and other GNSS?
The ADS-B data used by this map includes information on the accuracy of the navigation system used by each aircraft, but doesn't specify the type of navigation system. It could be GPS, another global navigation satellite system (GNSS) like GLONASS, or it could be an inertial navigation system (INS). My understanding is that most aircraft are using GPS, so that's probably mostly what the map shows.
Does red and yellow always mean there's jamming?
No. Red and yellow hexes show where a significant number of aircraft reported low navigation accuracy. This often seems to be in regions where it's known or suspected that GPS jamming is occurring, but the data doesn't tell me what's causing the low accuracy. See the next question.
What can cause an aircraft to report low navigation accuracy?
Most aircraft with ADS-B are using GPS, and from what I can tell the most common reason for aircraft GPS systems to have degraded accuracy is jamming by military systems. At least, the vast majority of aircraft that I see with bad GPS accuracy are flying near conflict zones where GPS jamming is known to occur.
Other causes of low GPS accuracy:
- Testing of military jamming systems outside of conflict zones (common in the southwestern United States)
- Jamming systems used to protect Russian oligarchs from drones
The site is called "GPSJAM" but it might not be GPS or jamming?
That's right. The site is gpsjam.org, but the map might not show GPS nor jamming. I just think "gpsjam.org" sounds better than "potential-navigation-system-interference.org".
What are the conflict zones where GPS jamming is regularly observed?
GPS interference has expanded dramatically since I started tracking it in 2022. The regions where I most often observe jamming and spoofing include:
- The Black Sea and surrounding areas. Crimea, the waters around it, and nearby airspace in Romania and Bulgaria see near-constant jamming and spoofing.
- The Baltic Sea region. Poland, Lithuania, Latvia, Estonia, Finland, Sweden, and even parts of Germany regularly show interference. Most nations assume it's done by Russia.
- The Eastern Mediterranean and Middle East. Iraq, Lebanon, Cyprus, Turkey, Israel, Egypt, Syria—this whole region lights up regularly. Large-scale spoofing events are common.
- The Persian Gulf and Strait of Hormuz.
- Parts of South Asia. The areas around Lahore, Pakistan and Yangon, Myanmar show up frequently, likely related to drone warfare.
You'll also notice interference in the southwestern United States, particularly in Texas. This isn't conflict-related and it's not jamming—it's military trainer aircraft performing aggressive aerial maneuvers that temporarily block their own GPS antennas. The aircraft are flying just fine; they're just momentarily unable to see the sky.
What time zone are the dates in?
UTC.
When is the site updated with new data?
Every 24 hours, soon after midnight UTC.
I live in one of the red zones and my GPS was fine?
The map is based on aircraft reports, and aircraft fly thousands of feet above the ground where they have line-of-sight to many more potential sources of GPS interference than you do on the ground. The map also aggregates a 24 hour period, so it's possible for interference to be present for a short time, still affect lots of aircraft and result in a region being colored red, but GPS was still fine for most of the day.
Why aren't there red or green hexes on some parts of the map?
That's where there were either no aircraft flying with ADS-B (for example, in an active war zone) or there were no receivers feeding data to ADS-B Exchange.
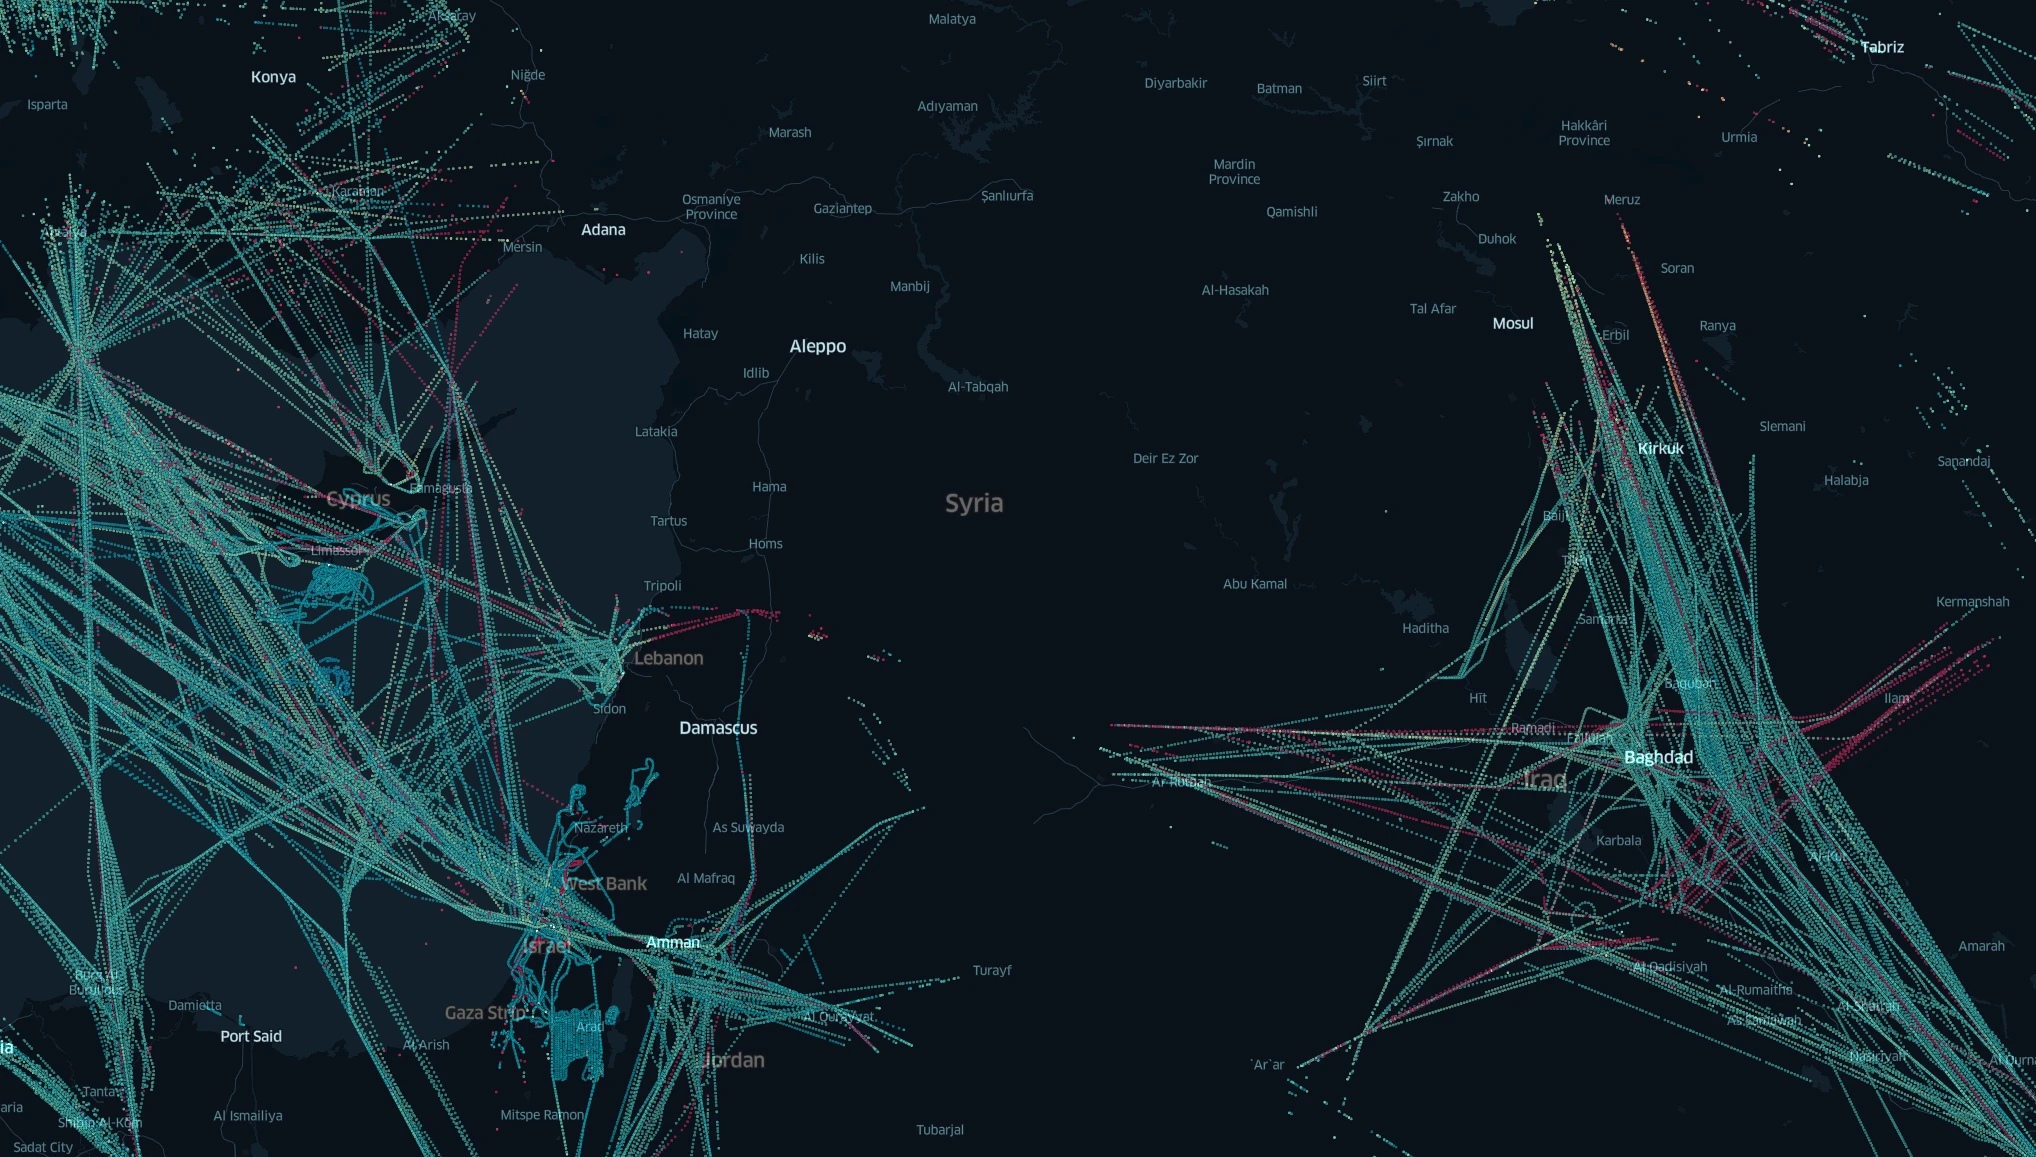
What's that cool background image on some pages?
It's a map showing one day—March 5, 2022—of flights in the eastern Mediterranean, with each ADS-B position report color coded to show the navigation accuracy (NACp, to be specific): High accuracy is blue and low accuracy is red.
How is the percentage of bad aircraft calculated?
The formula used for each hex is percent_bad_aircraft = 100 * (num_bad_aircraft - 1) / (num_good_aircraft +
num_bad_aircraft), where num_bad_aircraft
is the number of aircraft that flew through the hex in the 24 hour period that reported bad navigation
accuracy, and
num_good_aircraft is the number of aircraft that flew through the hex in the 24 hour
period that reported good navigation accuracy. I subtract 1 from the count of bad aircraft to limit
possible false positives in hexes through which only a small number of aircraft flew. This attempt
at denoising the data does bias the map to not show potential interference in hexes where there's
very little data.
What happened to the globe?
I miss the globe (and the other projections–pour one out for Winkel Tripel), but it was costing me a lot of money every month, and this site is free to use. When the free (or cheap) mapping software and data providers catch up to Mapbox's globe technology, I'll gladly bring it back.
Maybe someday there will be a Gold membership level for GPSJAM that includes the globe…
Is the data complete?
No. There is no data before 2022-02-14.
Data on some other dates is incomplete:
- 2022-02-14
- This is the first day I started collecting data, and is incomplete because of that.
- 2022-06-08, 2022-06-09
- I had data collection issues on those dates, so the data is incomplete.
- 2022-10-13, 2022-10-14
- A data collection issue led to only about 20% of the data for these days being available.
- 2022-12-27
- An internet outage resulted in a loss of almost 6 hours of data, from 13:49 UTC to 19:20 UTC.
- 2024-01-28
- A hardware failure in the GPSJAM computing complex led to a data loss starting at 18:17:39 UTC and running until 2024-01-29 01:02:33 UTC, a total of slightly under 7 hours.
- 2024-01-30
- A power outage resulted in a loss from 10:22 UTC to 20:31 UTC, a total of 10 hours.
- 2024-07-14
- A network issue resulted in a loss of data from 12:30 UTC on 2024-07-14 until 14:40 UTC the next day, a total of about 26 hours.
- 2024-07-15
- A network issue resulted in a loss of data from 12:30 UTC on 2024-07-14 until 14:40 UTC the next day, a total of about 26 hours.
- 2025-01-08, 2025-01-09
- Power outages caused by the Los Angeles wildfires resulted in a loss of data from 0251Z on 2025-01-08 through 1552Z on 2025-01-09, a total of 37 hours.